Performance testing team knows how to find the performance stats related to BizTalk application like how much time it takes to process n number of messages, how much time an orchestration takes or average time taken by Orchestration etc .
There was a quite an interesting ask by Performance testing team - How to check time taken by each shape in Orchestration
This question forced me to scratch my head for a while :).
But yes there is a way to find the time taken by each step, you just need to enable tracking on Orchestration and use orchestration debugger
To demonstrate how,
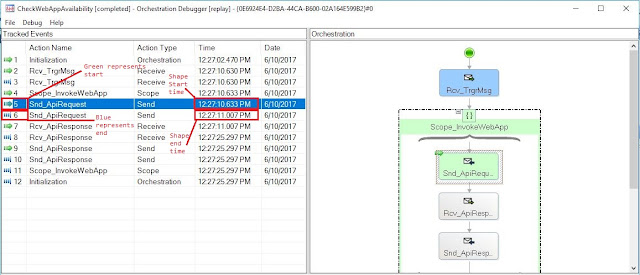
below is the orchestration debugger of a simple orchestration I have - which upon receiving a message
1.calls a web api,
2.collects response and
As can be seen,
the Green color arrow denotes start of shape and
the Blue colored denotes end of shape and time of the shape start and end is also tracked upto milliseconds.
So the time taken by SndApiRequest would be 11.007-10.633 = 0.374
So the time taken by SndApiRequest would be 11.007-10.633 = 0.374
If you have questions or suggestions, feel free to do in comments section below !!!
Do share if you find this helpful .......
Knowledge Sharing is Caring !!!!!!
Related Post
- BizTalk Server: Multiple XML files to Single FlatFile Using File Adapter
- BizTalk 2013: Inserting RawXML (Whole Incoming XML Message) in SQL database
- BizTalk 2013: Inserting RawXML (Whole Incoming XML Message) in SQL database - Part 2
- Is it possible to have Map Chaining on the Port Level
- Promoting custom context property using Pipeline Component
- Custom ZipReceivePipeline to Unzip Multi-Type Messages
- Grouping and debatching Inbound Messages from WCF SQL Adapter - BizTalk 2010
- Polling data from SQL using WCF-SQL Adapter in BizTalk 2010 - TypedPolling(From Multiple table)
- Grouping XML Messages using custom XSLT- BizTalk 2010
- Insert Records in SQL Server using WCF-SQL Adapter in BizTalk 2010 - Composite operation(Multiple Records insertion)
- Insert Records in SQL Server using WCF-SQL Adapter in BizTalk 2010- Composite Operation (Message Transformation Pattern)
- Debatching(Splitting) XML Message - BizTalk 2010
- Debatching(Splitting) XML Message in Orchestration using DefaultPipeline - BizTalk 2010
Tags:
BizTalk

nice hint but is it possible to get an extract of those figures and compare over time with excel?
ReplyDeleteAll of the information is in the BizTalk databases. You just have to create the right query for what you want to see.
ReplyDeleteGood one
ReplyDelete